Scalars
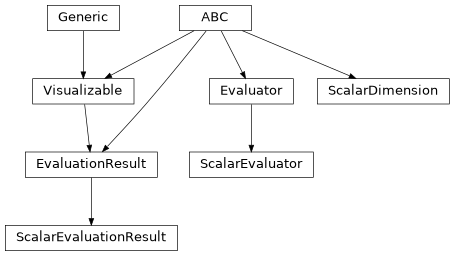
- class ScalarEvaluator(confidence=1.0, tolerance=0.0, min_num_samples=1024, plot_scale='linear', tick_format=ValueType.LIN, plot_surface=True)[source]
Bases:
EvaluatorEvaluation routine for investigated object states, extracting scalar performance indicators of interest.
Evaluators represent the process of extracting arbitrary performance indicator samples \(X_m\) in the form of
Artifactinstances from investigated object states. Once aMonteCarloActorhas set its investigated object to a new random state, it calls theevaluateroutines of all configured evaluators, collecting the resulting respectiveArtifactinstances.For a given set of
Artifactinstances, evaluators are expected to report aconfidence()which may result in a premature abortion of the sample collection routine for a singleGridSection. By default, the routine suggested by Bayer et al.[1] is applied: Considering a tolerance \(\mathrm{TOL} \in \mathbb{R}_{++}\) the confidence in the mean performance indicator\[\bar{X}_M = \frac{1}{M} \sum_{m = 1}^{M} X_m\]is considered sufficient if a threshold \(\delta \in \mathbb{R}_{++}\), defined as
\[\mathrm{P}\left(\left\| \bar{X}_M - \mathrm{E}\left[ X \right] \right\| > \mathrm{TOL} \right) \leq \delta\]has been crossed. The number of collected actually collected artifacts per
GridSection\(M \in [M_{\mathrm{min}}, M_{\mathrm{max}}]\) is between a minimum number of required samples \(M_{\mathrm{min}} \in \mathbb{R}_{+}\) and an upper limit of \(M_{\mathrm{max}} \in \mathbb{R}_{++}\).- Parameters:
confidence (
float) – Required confidence level for the given tolerance between zero and one.tolerance (
float) – Acceptable non-negative bound around the mean value of the estimated scalar performance indicator.min_num_samples (
int) – Minimum number of samples required to compute the confidence bound.plot_scale (
str) – Scale of the plot. Can be'linear'or'log'.tick_format (
ValueType) – Tick format of the plot.plot_surface (
bool) – Enable surface plotting for two-dimensional grids. Enabled by default.
- initialize_result(grid)[source]
Initialize the respective result object for this evaluator.
- Parameters:
grid (
Sequence[GridDimensionInfo]) – The parameter grid over which the simulation iterates.- Return type:
Returns: The initialized evaluation result.
- property confidence: float[source]
Confidence threshold required for premature simulation abortion.
The confidence threshold \(\delta \in [0, 1]\) is the upper bound to the confidence level
\[\mathrm{P}\left(\left\| \bar{X}_M - \mathrm{E}\left[ X \right] \right\| > \mathrm{TOL} \right)\]at which the sample collection for a single
GridSectionmay be prematurely aborted [1].- Raises:
ValueError – If confidence is lower than zero or greater than one.
- property min_num_samples: int[source]
Minimum number of samples required to compute the confidence bound.
The minimum number of samples \(M_{\mathrm{min}} \in \mathbb{R}_{+}\) is the minimum number of samples required to compute the confidence bound for a single
GridSection.Returns: Minimum number of samples \(M_{\mathrm{min}}\).
- Raises:
ValueError – If minimum number of samples is less than two.
- property tolerance: float[source]
Tolerance level required for premature simulation abortion.
The tolerance \(\mathrm{TOL} \in \mathbb{R}_{++}\) is the upper bound to the interval
\[\left\| \bar{X}_M - \mathrm{E}\left[ X \right] \right\|\]by which the performance indicator estimation \(\bar{X}_M\) may diverge from the actual expected value \(\mathrm{E}\left[ X \right]\).
Returns: Non-negative tolerance \(\mathrm{TOL}\).
- Raises:
ValueError – If tolerance is negative.
- class ScalarEvaluationResult(grid, evaluator, accuracy=0.0, confidence=1.0, min_num_samples=1024, plot_surface=True, base_dimension_index=0)[source]
Bases:
EvaluationResultBase class for scalar evaluation results.
- Parameters:
grid (
Sequence[GridDimensionInfo]) – Simulation grid.evaluator (
Evaluator) – Evaluator associated with this result.accuracy (
float) – Acceptable bound around the mean value of the estimated scalar performance indicator.tolerance – Required confidence level for the given accuracy.
min_num_samples (
int) – Minimum number of samples required to compute the confidence bound.plot_surface (
bool) – Enable surface plotting for two-dimensional grids. Enabled by default.base_dimension_index (
int) – Index of the base dimension used for plotting.
- add_artifact(coordinates, artifact, compute_confidence=True)[source]
Add an artifact to this evaluation result.
- create_figure(**kwargs)[source]
Create a new figure for plotting.
Returns: Newly generated figure and axes to plot into.
- runtime_estimates()[source]
Extract a runtime estimate for this evaluation result.
Returns: A numpy array containing the runtime estimates for each grid section. If no estimates are available,
Noneis returned.
- class ScalarDimension[source]
Bases:
ABCBase class for objects that can be configured by scalar values.
When a property of type
ScalarDimensionis defined as a simulation parameterGridDimension, the simulation will automatically configure the object with the scalar value of the sample point during simulation runtime.The configuration operation is represented by the lshift operator <<.