Symbols
Communication symbols represent a stream of complex-valued symbols that are processed during coherent communication.
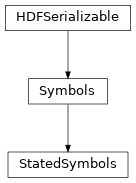
- class Symbols(symbols=None)[source]
Bases:
HDFSerializableA time-series of communication symbols located somewhere on the complex plane.
- Parameters:
symbols (Union[Iterable, numpy.ndarray], optional) – A three-dimensional array of complex-valued communication symbols. The first dimension denotes the number of streams, the second dimension the number of symbol blocks per stream, the third dimension the number of symbols per block.
- append_stream(symbols)[source]
Append a new symbol stream to this symbol seris.
Represents a matrix concatenation in the first dimensions.
- Parameters:
symbols (Union[Symbols, np.ndarray]) – Symbol stream to be appended to this symbol series.
- Raises:
ValueError – If the number of symbols in time-domain do not match.
- Return type:
- append_symbols(symbols)[source]
Append a new symbol sequence to this symbol seris.
Represents a matrix concatenation in the second dimensions.
- Parameters:
symbols (Union[Symbols, np.ndarray]) – Symbol sequence to be appended to this symbol series.
- Raises:
ValueError – If the number of symbol streams do not match.
- Return type:
- property num_blocks: int
Number of symbol blocks within this symbol series.
- Returns:
Number of symbols
- Return type:
- property num_streams: int
Number of streams within this symbol series.
- Returns:
Number of streams.
- Return type:
- property num_symbols: int
Number of symbols per stream within this symbol series.
- Returns:
Number of symbols
- Return type:
- property plot_constellation: _ConstellationPlot
Plot the symbol constellation.
- class StatedSymbols(symbols, states)[source]
Bases:
SymbolsA time-series of communication symbols and channel states located somewhere on the complex plane.
- Parameters:
symbols (Union[Iterable, numpy.ndarray]) – A three-dimensional array of complex-valued communication symbols. The first dimension denotes the number of streams, the second dimension the number of symbol blocks per stream, the the dimension the number of symbols per block.
states (numpy.ndarray | SparseArray) – Four-dimensional numpy array with the first two dimensions indicating the MIMO receive and transmit streams, respectively and the last two dimensions indicating the number of symbol blocks and symbols per block.
- dense_states()[source]
Return the channel state in dense format.
Note that this method will convert the channel state to dense format if it is currently in sparse format. This operation may be computationally expensive and should be avoided if possible.
Returns: The channel state tensor in dense format.
- Return type:
- property num_transmit_streams: int
Number of impinging transmit streams.
Returns: Number of streams.
- property states: ndarray | SparseArray
Symbol state information.
Four-dimensional numpy array with the first two dimensions indicating the MIMO receive and transmit streams, respectively and the last two dimensions indicating the number of symbol blocks and symbols per block.
- Raises:
ValueError – If the state array is not four-dimensional.
ValueError – If the state dimensions don’t match the symbol dimensions.
- class _ConstellationPlot(symbols)[source]
Bases:
VisualizableAttribute[ScatterVisualization]Plot the symbol constellation.
Essentially projects the time-series of symbols onto a single complex plane.
- Parameters:
- Returns:
Handle to the created matplotlib.pyplot figure object. None if the axes were provided.
- Return type:
Optional[plt.Figure]